

Case Study of ‘Detroit Through the Years’
An increasing amount of place-based data is being made available via the Internet, though the implication this will have on historic preservation are unclear.
The National Register Information System (or NRIS) is a workhorse. This database has thousands of records searchable by geography and keywords. While lacking on aesthetics and sometimes functionality (pages are often slow to load), this is among the most important of resources at the federal level for those engaged in historic preservation.
National Historic Landmarks are also available to view online. Because of the smaller quantity of NHL’s (at least compared to their National Register brethren) more information is displayed about each one (in a profile format with pictures and text drawn from a database).
The National Trust for Historic Preservation at the time of this writing has replaced a beta version of what is called the “Preservation Atlas”. Here selected hotels and historic places are made available to view on an interactive map using what is called the Google API.
Efforts at the state and local level to make place-based data available online are too numerous to mention every one, except to say that there is a great diversity of approaches and that these vary from state-to-state, and municipality-to-municipality.
For the purposes of our study we will focus on Michigan and Detroit.
Michigan Historic Sites Online has been developed and is managed by the State Historic Preservation Office. Here it is possible to do a key word search or a community search. The advanced search option limits the results to National Historic Landmark, National Register, State Register listed, and State Historical Marker erected. Results are then displayed in a typical search result format with photograph, resource name, city and county, and link to a map. The map is generated using a GIS system. Latitude and longitude points are indicated and shown over a basic street map. Other basemap display options include aerial photo, topo map, elevation map, and land cover, though these are slow to load, limiting their usefulness.
Resources available at the city-level are symptomatic of the challenges that most municipalities face managing place-based data, though in Detroit’s case this is many times worse. The Detroit Historic District Commission is responsible for designating properties historic at the local level. Thus it might be expected to have existing local buildings and districts listed on their website at a minimum. Instead this is not available and what is there are a series of crude image maps that lead users to data that is incomplete and broken in many cases. The implication of this shortcoming is that the only reliable way to confirm the historic designation status of buildings is to contact staff directly – placing an enormous burden on an office that is already short-staffed.
It is in this milieu that the Detroit1976 project was born.
What We Did
Recognizing how ample place-based data existed in both online and off-line formats, we made it our objective to bring this data together at one central location and to make it accessible visually using interactive mapping technology.
To start we digitized survey data from the last intensive level survey in Detroit – the 1976 Detroit Urban Conservation Project. Once put into a database this data served as a baseline upon which additional data was added.
Next, data from the National Register of Historic Places and National Historic Landmarks was gathered from websites at the state and federal level and this too was combined with survey data in the database.
Then local historic designation was gathered. Because this was not reliably available online, we had to work with the Historic District Commission to determine what has been designated, as well as digitizing a number of copies of lists of these resources available in paper format only. Once this was done, this data too was added to our ever-expanding database.
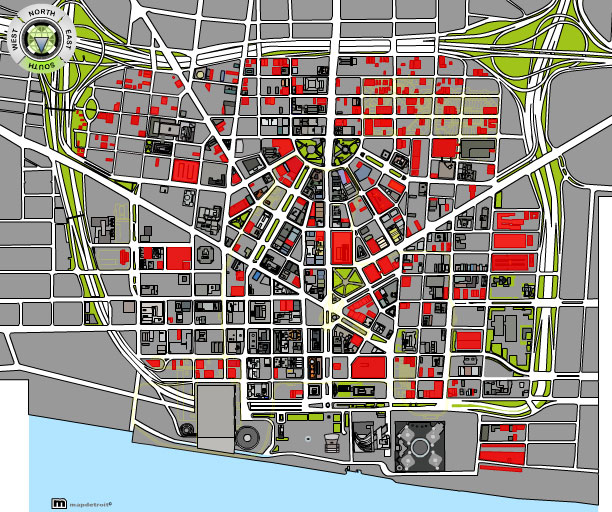
Substantial changes occurred to the buildings and historic fabric of the Detroit CBD between 1976 and 2006 (45% of buildings were demolished), thus it was necessary to compare historical data with the city as it appears today, to determine what was changed or been lost in the past three decades. To do this we sorted all of our database results by block. Then we located each block on Sanborn maps produced between 1950 and 1951. We identified the location of buildings from the 1976 on these maps. If the outline or “footprint” of the building was missing on present-day aerial maps, we determined these buildings had been demolished and made a notation indicating that. In a very small number of cases new buildings had been constructed in that period so we also indicated that. For those buildings that we could confirm existed in 1950, 1976, and 2006, we found the latitude and longitude for these buildings and incorporated this into the database as well.
Once this data was all gathered and put into a database online, the next step was to display this data visually using interactive maps.
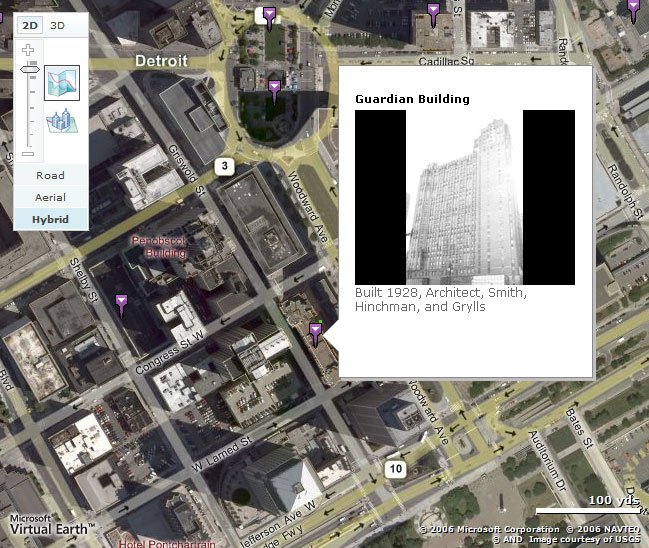
To start with we used present-day aerial imagery from the USGS and street data from NAVTEQ through the Microsoft Virtual Earth program. To this we added historic aerial maps from 1949, 1952, 1956, 1961, 1976, 1981, 1997, and 2005, and made it so that these overlapped the present-day aerial maps as accurately as possible. Maps from each of these years were then included as layers, making it possible to turn them on or off by pressing “Show” or “Hide”.
With our data available in an online database and our maps put together, it was now possible to combine these, displaying points of data over these different maps using “pins”. Pins are basically a small image displayed over the map where the latitude and longitude data indicated, and when users scrolled over these a “detail window” appeared showing building name, photograph, and other descriptive information. What is nice about using this system is that it is possible to display all pins or to only display a selection of pins like all “National Register” properties.
In addition to the present-day and historical aerial maps, two other options were provided to display data – a birds-eye view showing buildings from all four sides using 2005 imagery generated by the Pictometry International Corp. A 3d view was also made available using recently developed technology by Microsoft in which it is possible to fly through and move about a 3d version of downtown Detroit. For each of these methods, it was also possible to display some or all pins on the maps and to scroll over them to find out information about specific buildings.
What We Found
While ample place-based data exists and a growing amount of this data is being made available online, coordination between the federal, state, and local governments to display this data and make this data available to the public is weak at best.
When buildings are individually listed on the National Register, this is fairly easy to do. When these buildings are in a district, however, it is necessary to determine each building in the district and whether a given resource is “contributing” or “non-contributing” as historic designation status has an impact on tax credits and what may or may not be done with a given property.
By doing the necessary legwork we were able to show how for any geographic area it is possible to pool this data together and to make it available using a visual approach with interactive online maps. This opens the potential of making more data accessible to more people than has ever been possible before. But to accomplish this goal fully will require a high level of cooperation between various different government agencies. Government acting along cannot be relied upon to generate the sort of innovative approach like the one we used. That is why we must conclude that close cooperation between the public and private sectors on accumulating and mapping data must occur.
This public-private partnership and collaboration has the potential to rectify a number of challenges that we encountered in our project:
- inconsistencies in the names of cultural resources between the state and federal levels
- lag in updating data between the federal, state, and local level
- unclear connections between different sources of data as it relates to specific places (i.e. it is not possible now to see the federal, state, and local designation status for a given building)
- limited or no data available on non-listed buildings
The Naviciti Vision
The innovations of our approach are two-fold: 1) creating online interactive tools that people can use to upload and manage data, and 2) to display this data visually on a variety of present-day and historical maps in aerial, birds-eye, and 3d view.
We believe what we have accomplished in Detroit represents only the tip of the iceberg for managing place-based data in the future.
Second generation tools that we are developing now will build on the innovative tools we already have to upload and manage data and make it possible to relate different types of data (i.e. National Register listed, National Historic Landmark listed, local designation, etc.) with different methods to display it (aerial maps, 3d view, etc.). For instance, it might be possible to indicate that National Register data can only be displayed on a present-day aerial map or that National Landmarks data only be displayed in 3d view from a specific angle.
These second generation tools will also make it possible to include an unlimited number of user-generated tags for places. For instance for the Guardian Building instead of just having the date built, architect, and historic designation status, it might be possible to include tags like “skyscraper”, “orange brick”, “Art Deco”, and “murals”. A search function in the second generation map interface will then make it possible to isolate all known occurrences of places with given tags and have those display on the map dynamically. This allows comparisons across multiple sets of data that if done using conventional methods would take an extensive amount of time and in many cases would not be possible at all. Thus, the single greatest advantage of the technology – saving time while allowing a level of interpretation and analysis that previously was never possible.
Finally, the potential that this project reveals is making all place-based data available at a single location, to have this added to and managed by multiple independent sources (federal, state, local, and private sector) collaborating on the project together, and to allow rich comparisons of resources at a local, regional, statewide, and national level.
Benefits
Benefits of such a comprehensive approach to managing place-based data are significant.
…for Public Officials
Public officials would save a substantial amount of time that is spent responding to individual reference requests. And as anyone in business will tell you, time is money. There is also the frustration that comes from seeking to fulfill their mission using emerging interactive technologies. By essentially solving the technology problems that come from managing place-based data, this allows public officials to focus on the preservation aspects of their job instead of on technology. Applied at the federal level especially, this technology has the potential to replace or to greatly improve the antiquated NRIS system. Seeing historic resources in proximity to a proposed project would assist in the environmental review process. Finally, collaboration between all levels of government would help to bring consistency to naming conventions and eliminate discrepancies in naming, format, and keeping sources up-to-date.
…for Economic Development
Saving time for public officials and helping them to focus on their core responsibilities, would in turn have a direct impact on economic development. Presently the approval process for National Register listing, tax credits, and other preservation-related work is time consuming and presents a major delay for projects seeking to get approved. By saving time for public officials especially, this increases the likelihood that more projects will be approved in a shorter period of time.
Another limitation when it comes to preservation and economic development is that for the layperson the system of historic designation and tax credits is difficult to understand. Making owners and occupants aware of their historic significance of their building by pooling information and making it accessible visually might then encourage them to care for their building more. Not to mention that professionals preparing tax credit, National Register, and other applications would benefit from easier access too.
Finally, making data available to what is potentially a worldwide audience greatly expands the audience of people who might participate in the historic preservation process. Being able to see designated resources in their neighborhood context would assist in the decision making process for whether a preservation project should go ahead or not. Making the process of determining whether a property is a certified local resource online would greatly help with tax credit applications and getting them approved. And ultimately the time saved on this would free up both public officials and developers to focus on completing more development projects.
…for Education
Finally there is massive potential for public education. Providing easier access to place-based data would help general audiences to increase their knowledge, understanding, and appreciation of historic resources by making information about them easier to access.
Taken a step further, public engagement may be facilitated by creating tools to report on the current status of buildings (whether they have been altered, demolished, or are threatened). And the use of present-day aerial maps and comparison of these with data on places and historical aerial maps would help to determine whether buildings are still present.
The possibility to conduct advanced research by applying tags to places and making these searchable would most certainly benefit historians, architectural historians, and scholars in other disciplines, as well as teachers and students studying some aspect of the built environment.
Those developing heritage tourism materials (maps, walking tours, etc.) could incorporate data made easily accessible into their tour program. Adding a multimedia component to tours might then be possible showing archival data. The resource could also be used to answer questions on the spot (i.e. show me all Albert Kahn buildings”) and to direct people to once the tour is over.
The greatest potential of this technology perhaps is allowing a disbursed audience of people including public officials at the federal, state, and local government, non-profit and for-profit organizations, and general audiences to actively view and contribute to an ever-expanding collection of place-based data and to identify possible opportunities and threats.
Appendices
Sources of historic designation data and where it resides:
National Parks Service
National Historic Landmarks, http://www.cr.nps.gov/nhl/
These are the crème-de-la-crème of historic properties. Today fewer than 2,500 historic places bear this national distinction.
National Register of Historic Places, http://www.nr.nps.gov/
Most common way to recognize significant properties at the national level.
State Historic Preservation Office
State Register of Historic Places [Michigan]
Similar to National Register of Historic Places, though at the State level.
State Historical Markers [Michigan]
Applicants may request these large green metal markers for historically significant buildings and sites in Michigan.
Survey Data
For this study we used original copies from the State of Michigan for the 1976 Detroit Urban Conservation Project.
Municipalities
Detroit Historic District Commission, http://www.ci.detroit.mi.us/historic/default.htm
This agency has local historic district designation data, and historic district study reports.
Sources of historical data:
– Sanborn Fire Insurance Maps, http://sanborn.umi.com/
– David Rumsey Map Collection, http://www.davidrumsey.com/
– Survey Cards
– Birdseye Maps
– City Directories
– Historical Photographs
– Building Plans
– Building Permits
– Secondary Documents
Appendix: National Register Information System
Overview
The National Register of Historic Places is in the process of digitizing the National Register collection, which contains over a million pages of text and a million photographs on properties listed since 1966. The digitization standards we have relied on for guidance are those established by the National Archives and Records Administration. The master copies are kept as TIFFs while more compact formats optimized for web delivery are offered through Adobe Acrobat files (specifically JBIG2 for text and JPEG 2000 for photos). Currently we have completed digitization of Multiples Covers, NPS and GSA-owned properties, all National Historic Landmarks, the states of KY, PR, DC, HI, and the text of SC. Additionally all properties with an area of significance of Aviation or Ethnic Heritage have been digitized. We have also been able to “harvest” digital data from several State Historic Preservation Office initiatives. Beginning in fiscal year 2007 these subsets will begin to appear through NPS Focus, a National Park Service digital library solution. Our method includes digitizing the complete text of the nomination, making it full text searchable and digitizing all photographs. Web searches are made available by exporting selected data elements to a Dublin core based metadata model and allowing the user to navigate in NPS Focus from here to digitized images.
Status
Currently we are not ‘base-funded’ for this activity so we have much work ahead of us but we now have some digitized data on about 25% of listing. We hope to add to these efforts in the coming years and to continue to benefit from the many excellent efforts of our partners. A gateway to those efforts is available at SHPO inventories . We are available to discuss collaborative efforts with interested states, federal agencies and tribes.